SINCE TIME BEGAN
IPCC REPORT : 2016 : WORLD MAPS
STT CSSP PHT : CANOE PEOPLES
TIPPING POINTS INTO XXII CENTURY
GEOLOGICAL SURVEYS
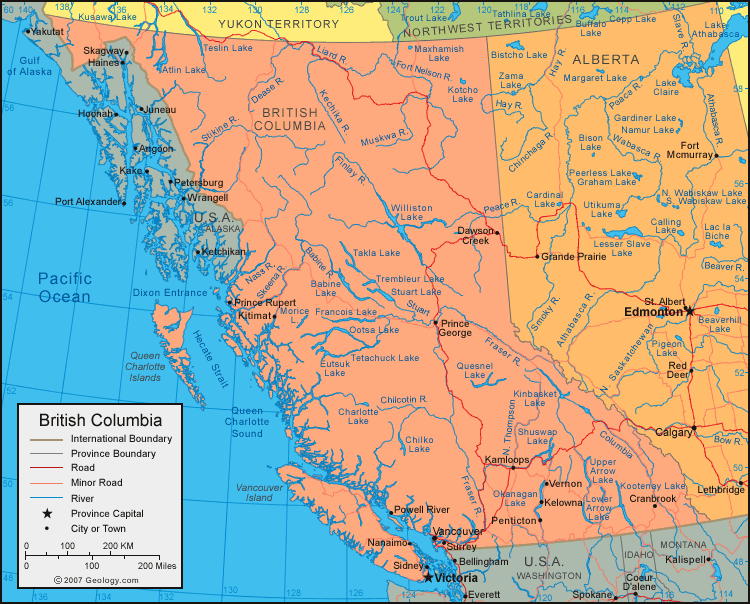
The peat resource of the northeast is the largest in the province but is subject to many
limitations on its development. Most of the peatlands are classified as sphagnum bogs and have
potential for both horticultural peat (surficial sphagnum) and fuel peat (underlying organic material
which is denser and more humified). Despite the extensive size of the deposits, use of the area as a
source of mined peat, other than on a local scale, is severely constrained. Major industrial markets are
far removed even though main provincial highways and railways exist in the area. However, the severest
restrictions to peat mining are imposed by climate which would limit the number of productive days
each year.
Data for the Fort Nelson area suggest that the extensive peatlands of the northeast contain
large areas of permafrost.
Environmental considerations and existing peat mining technology currently restrict any mining development north of the southern limit of discontinuous permafrost (Figure 1). In situ agricultural use of peatland fens in the Fort St. John - Dawson Creek area is practical, subject to the climatic constraints controlling agriculture in this area. As in the central Interior, peat deposits can be developed as a source of native hay and pasture for the ranching industry. Cultivated hay and cereal crops are also grown on some organic soils in this region.
Good sources of horticultural peat in the central Interior are limited and more detailed work is required to adequately predict any development possibilities. Peat bogs in northeastern British Columbia are very extensive and contain peat acceptable for both horitcultural and fuel uses but their suitability for mined peat is severely limited by climate and remoteness. Permafrost in the Fort Nelson area is a major limiting factor to peat extraction.


APPENDIX 6 PEATLAND INVENTORY INDEX MAP
List of 1:250 000 scale Inventory Maps (available separately and individually from this report)
RESOURCE INVENTORIES

IPCC REPORT : 2016 : WORLD MAPS
STT CSSP PHT : CANOE PEOPLES
TIPPING POINTS INTO XXII CENTURY
REFERENCES : ONE GEOLOGY : GEOLOGICAL ORGANIZATIONS GLOBAL : GENERAL GEOLOGY : DICTIONARY : RGSC MAPS : CANADIAN GEOGRAPHIC : COLLECTIONS
CANADA : GEOLOGICAL SURVEYS : PEAT RESOURCES : CANADA SURVEYS : CANADA DATA BASE : MAPS ; IMAGES : MAPS
WETLAND INVENTORY CANADA
BC PEAT INVENTORIES : BC NATURAL RESOURCES :MAPPING : EARLY PEAT INDUSTRY IN CANADA : PEATLAND INVENTORIES BC
Peatlands of Canada; Tarnocai, C; Kettles, I M; Lacelle, B. Geological Survey of Canada, Open File 6561, 2011, ; : Download the publication (zip 128261 KB)
BC PEAT INVENTORIES : BC NATURAL RESOURCES :MAPPING : EARLY PEAT INDUSTRY IN CANADA : PEATLAND INVENTORIES BC
Peatlands of Canada; Tarnocai, C; Kettles, I M; Lacelle, B. Geological Survey of Canada, Open File 6561, 2011, ; : Download the publication (zip 128261 KB)
Peatland Inventory of British Columbia : BCMEMPR Open File 1988-33
Document (PDF, 9.3MB) View Maps 1-12 (PDF, 19.8 MB) View Maps 13-24 (PDF, 17.4 MB) View Maps 25-36 (PDF, 13.4 MB) View Maps 37-48 (PDF, 15.2 MB) View Maps 49-60 (PDF, 9.76 MB) View Maps 61-73 (PDF, 14.3 MB)
Peatlands cover 12 per cent of the
land area of Canada (Tarnocai, 1984); yet, despite this potentially large resource, there is a lack of information on the actual extent of peat
resources in many parts of the country. A major reason for this is that peat
production has never been a significant industry in Canada. Although Canada has
a large part of the world peat resource (about 40 per cent), it has only about
0.2 per cent of the total peat production (Kivinen and Pakarinen, 1980).
Table
1 shows estimated peatland areas and production amounts for various countries.
TABLE 1 WORLD PEAT RESOURCES (after Kivinen and Pakarinen, 1980) Peatland Area
3 Peat Production (Tonnes x Mr) Country (ha x106 ) Fuel Peat Moss Peat Total
Canada 170 _ 488 488 U.S.S.R. 150 80 000 120 000 200 000 U.S.A. 40 - 800 800
Finland 10 3 100 500 3 600 U.K. 1.6 50 500 550 Ireland 1.2 5 570 380 5 950 West
Germany 1.1 250 2 000 2 250 It should be noted that other workers estimate the
total area of peatland in the country to be less than that shown in Table 1
(153 million hectares by Zoltai, 1980; and 129 million hectares by the Muskeg
Subcommittee of the National Research Council, 1977).
This discrepancy is
attributed to the lack of inventory data over much of the country, particularly
in northern areas. More recent data compiled by Tarnocai (1984) indicate the
total area of peatlands in Canada is 111 million hectares. Almost one-quarter
(22 per cent) of the total Canadian peatlands is found in the Northwest
Territories, followed by Ontario (20 per cent) and Manitoba (19 per cent).
Approximately 60 per cent of the total peatlands are perennially frozen
(ibid.). Data for British Columbia show the total peatland area to be 1.3
million hectares which is 1 per cent of the Canadian total and also about 1 per
cent of the total land area of the province. These figures are estimates based
on inventory data which cover less than 50 per cent of British Columbia,
Canada, North America.
Total volume of peat in the Pacific coast study area mapped by Tarnocai is
estimated to be 3854 million cubic metres [137,515,310,232 / 137 billion cubic feet] of which 2990 million cubic metres [] occur in flat and slope bogs. These bogs have a relatively thin surficial cover
of sphagnum peat overlying moderately deep, well-humified sedge, amorphous and
sedimentary peats. The horticultural quality of this bog peat is limited
because of high humification values and high sedge components but it has
potential as a source of fuel peat. Peat found in bogs of the Pacific coast
study area has an average energy value of 5.4 million kilocalories per tonne
(23 million kilojoules per tonne). These energy values are higher than the
national average peat energy value of 4.8 million kilocalories per tonne (20
million kilojoules per tonne) (Dendron Resource Surveys Ltd., 1985). Most of
the sphagnum and sedge-dominated peat types meet the criteria (such as degree
of humification, bulk density, calorific values, ash content) for acceptable
fuel-grade peat.
| $$$ Value | PEAT | PEAT | ||||||
| bbl oil | cubic feet | cubic meters | ||||||
| One BBL | $40.00 | $40.00 | $40.00 | |||||
| Billion | 138 | 5520 | ||||||
| 138,000,000,000 x $40= $5,520,000,000,000 | = $5 T |
Peatlands cover 12 per cent of the land area of Canada (Tarnocai, 1984); yet, despite this potentially
large resource, there is a lack of information on the actual extent of peat resources in many parts of the country.
A major reason for this is that peat production has never been a significant industry in Canada. Although
Canada has a large part of the world peat resource (about 40 per cent), it has only about 0.2 per cent of the
total peat production (Kivinen and Pakarinen, 1980). Table 1 shows estimated peatland areas and production
amounts for various countries.
TABLE 1
WORLD PEAT RESOURCES
(after Kivinen and Pakarinen, 1980)
Peatland Area 3
Peat Production (Tonnes x Mr) Country (ha x106
) Fuel Peat Moss Peat Total
Canada 170 _ 488 488
U.S.S.R. 150 80 000 120 000 200 000
U.S.A. 40 - 800 800
Finland 10 3 100 500 3 600
U.K. 1.6 50 500 550
Ireland 1.2 5 570 380 5 950
West Germany 1.1 250 2 000 2 250
It should be noted that other workers estimate the total area of peatland in the country to be less than
that shown in Table 1 (153 million hectares by Zoltai, 1980; and 129 million hectares by the Muskeg
Subcommittee of the National Research Council, 1977).
This discrepancy is attributed to the lack of inventory
data over much of the country, particularly in northern areas. More recent data compiled by Tarnocai (1984)
indicate the total area of peatlands in Canada is 111 million hectares. Almost one-quarter (22 per cent) of the
total Canadian peatlands is found in the Northwest Territories, followed by Ontario (20 per cent) and Manitoba
(19 per cent). Approximately 60 per cent of the total peatlands are perennially frozen (ibid.). Data for British
Columbia show the total peatland area to be 1.3 million hectares which is 1 per cent of the Canadian total and
also about 1 per cent of the total land area of the province. These figures are estimates based on inventory data
which cover less than 50 per cent of British Columbia.
The peatlands of the central Interior are concentrated in a triangular region with corners at
Smithers, 100-Mile House and a point northeast of Prince George. These organic deposits are fairly
accessible to main provincial highways and railways. Most of the peatlands are classified as fens or
undifferentiated organics which range from poorly to well decomposed. These are usually sedgedominated
peats, although brown moss peat is also common in the Cariboo - Chilcotin area. There are
few sphagnum bogs in the area; some large fens may have a thin sphagnum moss cover in their central
portion and be classed as fen-bog complexes.
Environmental considerations and existing peat mining technology currently restrict any mining development north of the southern limit of discontinuous permafrost (Figure 1). In situ agricultural use of peatland fens in the Fort St. John - Dawson Creek area is practical, subject to the climatic constraints controlling agriculture in this area. As in the central Interior, peat deposits can be developed as a source of native hay and pasture for the ranching industry. Cultivated hay and cereal crops are also grown on some organic soils in this region.
Good sources of horticultural peat in the central Interior are limited and more detailed work is required to adequately predict any development possibilities. Peat bogs in northeastern British Columbia are very extensive and contain peat acceptable for both horitcultural and fuel uses but their suitability for mined peat is severely limited by climate and remoteness. Permafrost in the Fort Nelson area is a major limiting factor to peat extraction.


APPENDIX 6 PEATLAND INVENTORY INDEX MAP
List of 1:250 000 scale Inventory Maps (available separately and individually from this report)
RESOURCE INVENTORIES


